Steps Toward an Improved Measure of Prices for Transportation
Why does a building a subway line in New York City cost almost $3.5 billion per mile, or about seven times as much as the rest of the world (Rosenthal 2017)? Why did a mile of Interstate built in 1993 cost four times as much in real terms as an Interstate mile built in the 1960s (Brooks and Liscow 2023)?
A consensus is building that infrastructure is expensive in the United States—more expensive than it used to be, and more expensive than in other developed countries. And although the United States spends more money on infrastructure, no evidence indicates that we get better infrastructure, better environmental outcomes, or better treatment of workers.
To understand when and how prices change, we need price indices. A price index measures how much an infrastructure provider—usually a government—pays to purchase a constant quality unit over time. But different price indices give widely different estimates of how much prices have increased. These differences stem from the growing importance of firm markups and government costs.
Understanding the problem begins with measurement
A price index compares the per unit price paid by a buyer of infrastructure over time. They allow us to evaluate whether prices increase more than overall inflation. Price indices also let us compare across places. For example, does the price index for the United States increase more than the price index for Spain?
An ideal price index measures the price of a constant quality good over time. A complicated piece of infrastructure, such as a bridge or port, is a mix of multiple different inputs: construction labor, material inputs, construction equipment, engineering design and labor, and project management human capital. A price index combines all these inputs, weighting each to represent its share in the final output.
Three problems that plague price indices
In measuring this per unit price, we are often bedeviled by three problems: keeping quality constant, accounting for firm profits, and measuring the costs incurred by the government.
Quality
Two issues are central in keeping quality constant. First, we need to define all the key attributes of a good. For example, this could include the number of trip miles a bridge facilitates, the bridge’s total allowed weight, and the bridge’s length. Given a fixed set of attributes, we can find the per trip mile cost to construct a bridge and a notionally similar cost for any other type of infrastructure. This is both challenging and possible. We can look to the literature on computers to understand how to do this (US Bureau of Labor Statistics 2022).
But there is a second, broader, issue in holding quality constant. Is the quality of a bridge the benefit the bridge gives to its direct users, those gaining transport access? This is the most obvious quality, and most analogous to how we measure quality in private markets.
But maybe the quality of the bridge also includes the benefits the bridge gives to nearby businesses and the costs of congestion it exerts on nearby households. This is the quality received by the purchasers of the bridge—the citizen, who pays through their taxes.
Thus, we must be clear about which quality we are trying to hold constant and consider providing indices that deal with both types of spending. Failing to properly measure quality can under or overstate price changes.
Markups
A price index needs to include not just the price that a firm pays for materials, labor, equipment and expertise, but also the profit that the firm receives. In markets with fewer firms, firms receive higher markups (Currier 2026). If we measure just the cost of the firm’s inputs (e.g., steel, concrete, labor, equipment), rather than the price at which the firm sells its outputs, we underestimate the cost to the government.
Administrative apparatus
While the government purchases infrastructure from private firms, it often incurs costs beyond those of letting and supervising the contract. We can call these costs those of the administrative apparatus. For example, if the government acquires land for a project and then laboriously changes land use regulations to allow a particular type of project, this cost should appear in a complete measurement.
These costs may be substantial. Nick Bagley writes that the accretion of rules themselves—any one of them well-meaning and justified—delivers diseconomies of scale (2019). Brooks and Liscow (2023) argue that if policy allows for veto points from many actors, these vetoes may raise the cost of planning and therefore the cost of the final output. Brooks and Liscow term the features that largely arise from the 1970s onward that give citizens greater input into government “citizen voice,” and argue that the rise of citizen voice helps explain cost increases.
The example of highways: What we actually measure
Do any existing price measures solve all these problems? No!
We illustrate one specific case using US highway spending. Figure 1 shows three major indices: the US Department of Transportation’s Bid Price Index, the Bureau of Reclamations’ Primary and Secondary Road Construction Cost measures, and the Brooks-Liscow expenditure index from the building of the US Interstate highway system. Costs as measured by the Brooks-Liscow expenditure index increase at a much faster rate than the other price-based measures.
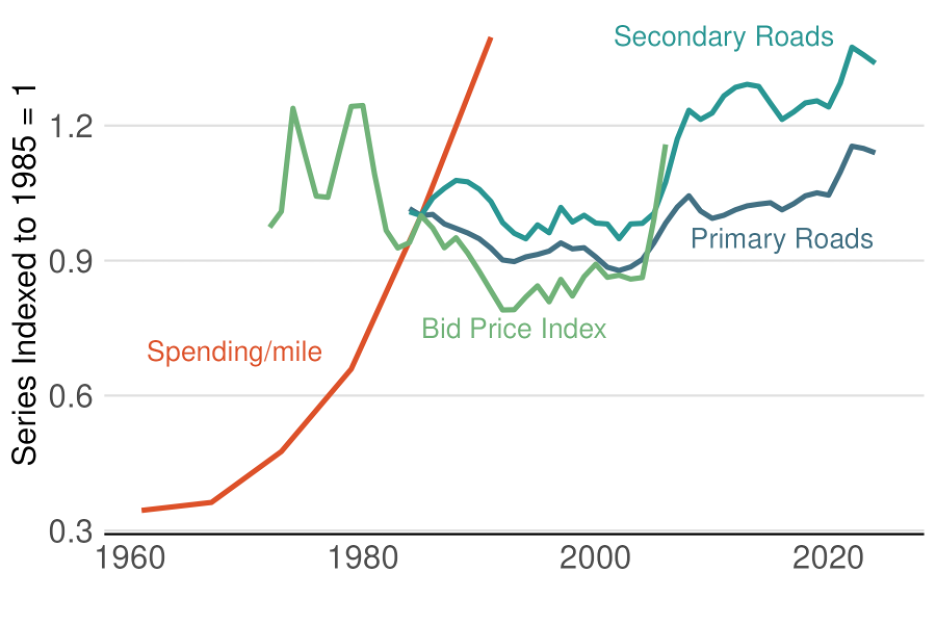
Why is this the case? The Department of Transportation’s index is a cost index, measuring the average price at which highway contractors bid for highway projects. This is the cost of only the private contractor part of the construction to the government, and it therefore excludes any costs of the administrative apparatus. This index also includes the markup on the firm’s original bid. However, because the bid may not be the final price, this is not the complete markup. As constructed, the Bid Price Index (now superseded by the National Highway Construction Cost Index [NHCCI]) measures the cost of the average project. Therefore, by design it does not hold quality constant.
The Bureau of Reclamation’s two indices — those for Primary and Secondary roads in Figure 1 — are similar types of cost indices and have exactly the same issues. Thus, both indices likely underestimate price increases as they capture neither the growing costs of firm markups nor the administrative apparatus.
In contrast, the Brooks-Liscow expenditure index takes total state Interstate highway spending and divides by miles constructed. This is a complete measure of all costs—those generated by the state and those of the private contractors. It includes markups and all the costs of the administrative apparatus. However, it does not hold quality constant. To the extent that Interstate highways became less noisy (due to soundwalls) or less accident prone (due to design), this measure overstates price increases.
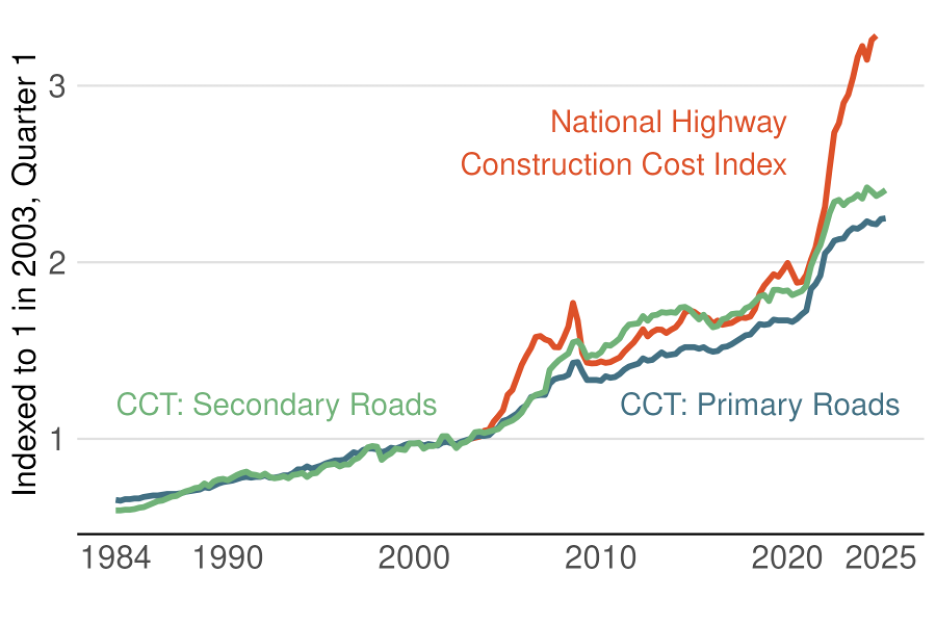
In recent years, we see a divergence, shown in figure 2, between the US Department of Transportation’s measure of cost (NHCCI) and prices as measured in the Bureau of Labor Statistics via producer prices. This divergence is likely due to the fact that the NHCCI includes more of firm markups than the BLS series.
Where can we improve?
Given the central importance of measuring infrastructure costs and the difficulties we find in doing so, where can we look to improve? I highlight three opportunities. First, we can do a better job on quality. New data on road roughness and a new ability to gather data from text suggest that researchers should be able to do better on this front. We can also distinguish between quality for users and quality for payers—and examine the extent of difference between these two groups.
Second, we can improve our understanding of markups in this area (see recent work by Currier [2026]). At least in very recent years, markups seem central to understanding changes. How big are they? Are they increasing across the board? Did they ever decrease? If so, why?
Finally, we can do better in understanding the components of the cost of the administrative apparatus. It may be that new methods of text analysis will allow us to better home in on exactly what it is that government does to impact cost. Or perhaps finding ways to glean information on expenditures on approval and oversight in state and local budgets may yield gains.
Additionally, the large private sector of consultants, whose business is built entirely on helping the public and private sector follow legislative or judicially driven compliance rules has emerged and blossomed since the 1960s. Better understanding the birth and growth of this sector may be an additional way to illuminate cost drivers.
References
Bagley, Nicholas. 2019. “The Procedure Fetish.” Michigan Law Review 118 (3): 345–402. https://doi.org/10.36644/mlr.118.3.procedure.
Brooks, Leah, and Zachary Liscow. 2023. “Infrastructure Costs.” American Economic Journal: Applied Economics 15 (2): 1–30. https://doi.org/10.1257/app.20200398.
Currier, Lindsey. 2026. “Competition and the Cost of US Infrastructure.” Tech. rep. Working Paper.
Rosenthal, Brian M. 2017. “The Most Expensive Mile of Subway Track on Earth.” New York Times, December 28, 2017. Accessed August 1, 2025. https://www.nytimes.com/2017/12/28/nyregion/new-york-subway-construction-costs.html.
US Bureau of Labor Statistics. 2022. “A Review of Hedonic Price Adjustment Techniques for Products Experiencing Rapid and Complex Quality Change.” Last modified September 15, 2022.Accessed July 9, 2025. https://www.bls.gov/cpi/quality-adjustment/hedonic-price-adjustment-techniques.htm.