Downtown Congestion Pricing: Lessons from New York
In Lehe (2019), I give the name “downtown congestion pricing” to a class of system in which cities charge tolls on vehicles visiting central areas as a means of controlling traffic. For a long time, Singapore was the only place with downtown congestion pricing—administering a simple, paper-based Area License Scheme from 1975-1998 and a more extensive Electronic Road Pricing system from 1998 onwards. Then, the decade from February 2003 to January 2013 saw London, Stockholm, Milan, and Gothenburg adopt various types of downtown congestion pricing schemes. Now, the launch of New York’s Central Business District Tolling Program (CBDTP) in January 2025 seems to mark the start of a second sprint. Tel Aviv (Etzion, 2026) and Auckland (Welch, 2026) are set to start tolling during the next five years, while Hanoi (Vo, 2026) and Jakarta (Al Hamasy, 2025) harbor serious plans.
Now that twenty months have passed since the launch of CBDTP, it is worthwhile to reflect on how it compares to the other systems and draw basic lessons.
Central Business District Tolling Program Design
CBDTP’s design is very simple and almost identical to the “Area C” system Milan adopted in 2012: a once-per-day toll to drive into (but not out of) a single zone, with two pricing periods (peak and off-peak in New York’s case, on and off in Milan). The London Congestion Charge is similar, except that the Congestion Charge is nested inside two other “emissions zones,” and it charges trips that merely leave the zone. The systems in Stockholm, Gothenburg and Singapore (as well as the planned systems in Tel Aviv, Hanoi, Auckland and Jakarta) vary prices throughout the day. The Tel Aviv plans, furthermore, incorporate several nested “toll rings.” Singapore’s ERP is the most complex and fine-grained: there are two cordons nested among a web of toll gantries on all major roads, and the city is now is now switching to ERP 2.0, a satellite-based system which also levies parking charges.
There is at least one virtue in the simplicity of the CBDTP design: a paucity of exemptions. A motif I noted in Lehe (2019) is that “Exemptions are highly consequential–to a degree that often surprises authorities–and so they are frequently rescinded or tightened.” Before implementation, leaders discussed many carveouts—including for nurses, firefighters, public employees, the Broadway theater district, and residents of Staten Island. But the exemptions that made it across the finish line are, for the most part, limited and practical: e.g., public buses, garbage trucks, emergency vehicles. The discount and tax credit for low-income drivers have such narrow qualifications that I doubt they are widely used, and these are not as enticing as complete exemptions. Similarly, there is an exemption for people with disabilities and their caregivers, but the requirements are fairly strict (thereby assuaging early concerns about the potential for abuse).
One exemption that has invited some argument is the one for taxis and for-hire vehicles, which do not pay the standard $9 toll. Instead these vehicles pay several other per-trip surcharges in the Congestion Relief Zone: one for trips south of 96th Street and another, for trips south of 60th Street (i.e., in the CBDTP’s Congestion Relief Zone). These charges are obviously more targeted than the once-per-day other vehicles pay. New York is the only place that has implemented congestion pricing alongside a special charge for taxi/ridehail trips. This has probably helped avoid problems that London faced when it exempted “minicabs” from the Congestion Charge—an exemption rescinded in 2019 after Uber’s arrival led to a surge in minicabs. The two surcharges, stacked atop the 8.875% sales tax on fares, make downtown taxis and ridehail trips into a substantial revenue stream.
Perceived Success
As far as design goes, the chief lesson of CDBTP is that downtown congestion pricing does not have to be complex or elegant. The design is simple, and the toll rate was set at the last minute by a political decision of Governor Hochul. Nevertheless, the program is perceived as a success. By March 2025, a plurality of New York City residents supported keeping it. The Post’s coverage is still opposed, but coverage at the Times, Bloomberg, Spectrum NY1, and even Car and Driver is positive. On the one-year anniversary of CBDTP, Mayor Mamdani joined Governor Hochul in celebrating the system and declared: “This is a program that has been successful no matter how you measure it.”
If you measure it. The launch of a downtown congestion pricing system is a major event, and authorities typically want to measure its impacts somehow. Stockholm and Gothenburg carried out before/after travel surveys and traffic measurements, then worked with researchers who published rigorous studies on the schemes’ effects (Eliasson et al., 2009; Börjesson and Kristoffersson, 2015). During the first five years of the London Congestion Charge, Transport for London carried out an Impacts Monitoring Programme involving over 100 bespoke surveys and studies. Results appeared in detailed annual reports alongside long-running longitudinal data, such as twice-yearly Moving Car Observer studies (where people drive around to measure travel times).
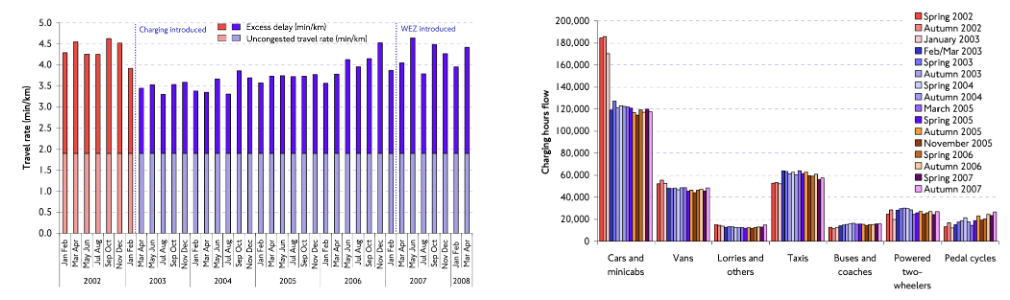
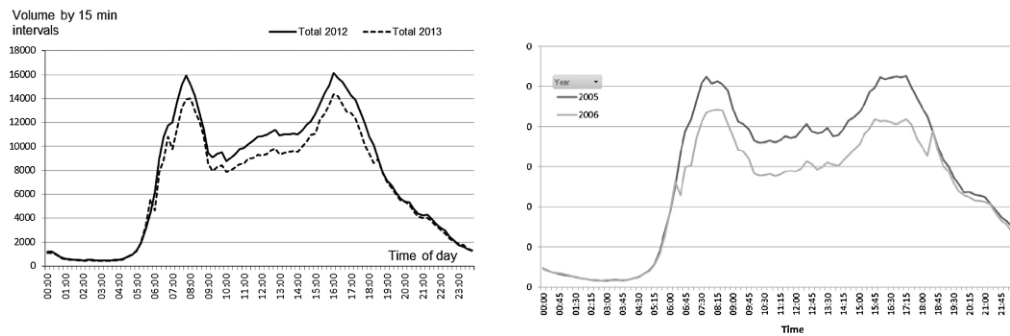
Figure 1: Before/after comparisons from London, Stockholm and Gothenburg.
While tremendous labor went into predicting the impacts of CBDTP for its 4,000 page Environmental Assessment (EA), authorities did not collect much new data in order to make before/after comparisons. For example, we do not know how many vehicles entered the Congestion Relief Zone (the area south of 60th Street but excluding FDR Drive and the West Side Highway) before 2025. The MTA’s Metrics Page has rich data on how many vehicles, of what class (e.g., motorcycle) enter the Zone at each location; but this data begins when tolling did.
You might think we know what entries were previously by reading news coverage: “an average 71,500 fewer vehicles entered the Central Business District each day through November.” But that reduction is relative to an interpolated “baseline.” The New York Metropolitan Transportation Council’s annual Hub Bound Travel Data Report estimates how many vehicles enter lower Manhattan (including both the Zone and the excluded roads) on a typical Wednesday in October. To compute the baseline, the MTA scaled the counts from the October 2023 Hub Bound Report (the most recent one until March 2026) to other months using adjustment factors derived from bridge and tunnel crossing volumes. This is probably in the neighborhood of the truth, but it isn’t the same thing as a record, and the baseline is an estimate of trips into all of lower Manhattan, not just the Zone.
Improvised Evidence
There also were no travel surveys asking New Yorkers about their travel before and after implementation. Elsewhere, such travel surveys shed light on basic questions such as “How did people adapt to tolls?” (Karlström and Franklin, 2009; Franklin et al., 2009). We do not know who altered their travel or how they did so.
In the absence of monitoring, evaluations of CBDTP’s impacts (both by the MTA and by independent researchers) have creatively repurposed data that was being collected anyway. A few examples:
- The MTA’s Congestion Relief Zone First Evaluation Report reports the change in VMT within the Zone (p. 19) by averaging two data sources provided by Streetlight Data: GPS data and connected vehicle data.
- Congestion Pricing Tracker, a project of two undergraduates at Brown University, polled the Google Maps API for travel times on 17 origin/destination pairs around New York City. These numbers were highly cited in early news coverage and commentary about CBDTP.
- C2Smart, a University Transportation Center based at NYU Tandon, has created a series of Tableau dashboards for unique datasets—including block-by-block traffic speeds from the Midtown in Motion signal timing program. For one dataset, they developed a computer vision methodology (Zuo et al., 2025) to take footage from extant city traffic cameras and estimate the density of pedestrians and vehicles visible. This is a difficult task because the cameras were not designed or positioned for this purpose.
- Chikish et al. (2026) combines EMS Incident Data on New York’s Open Data Portal with Open Street Map data, in order to estimate how CBDTP reduced emergency response times.
- Cook et al. (2025) estimates how the CBDTP affected speeds—inside and outside the Congestion Relief Zone— using data on trips routed through Google Maps. These data were available because five of eight co-authors were at Google Research. Since this is not a representative sample, they scale the flows to match those from public sources, such as those at toll plazas.
- A number of studies (Shanbhag and Di, 2026; Ferrante, 2026; Itzkowitz et al., 2026) use the city’s open datasets on motor vehicle collisions (for vehicles and for persons) in order to estimate safety impacts.
- Zhang et al. (2026) and Pandey et al. (2026) utilize the Taxi & Limousine Commission’s Taxi Trip Record Data to estimate how CBDTP affected ridehail trips.
- Several sources (e.g., Regional Plan Association) used open data on 311 Service Requests to show changes in noise and parking violation complaints.
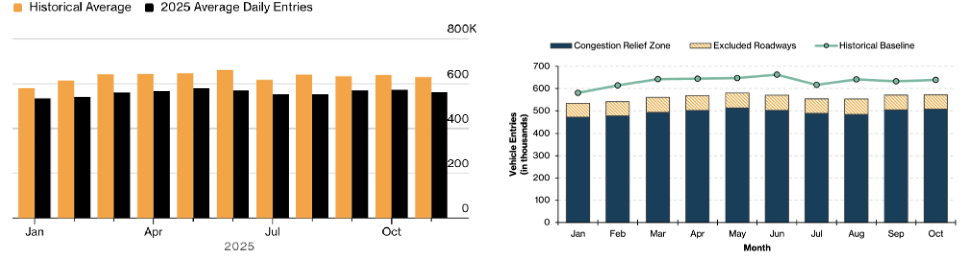
Figure 2: In the Bloomberg article, flows are presented as a “historical average.” But the actual data is an interpolated baseline.
These results were possible because New York City was already blessed with a rich array of sensors and open data. The lack of dedicated data collection has not impaired the program’s perceived success in the long run. Still, New York’s experience yields some lessons for other American cities.
First, the city should report travel time and speed statistics to the public immediately. Early media coverage of CBDTP was based on the only source available: Congestion Pricing Tracker, which pulled data from a Google Maps API. That API is not designed to evaluate interventions. Hence early coverage was consistently pessimistic: “travel times within the congestion zone have hardly budged” noted the New Yorker on February 3. By May 5th, Congestion Pricing Tracker reported “Traffic delays have decreased significantly across the board within the congestion zone.” Gradually falling travel times are more easily explained by Google Maps updating its predictions with post-implementation data than by a reverse rebound effect.
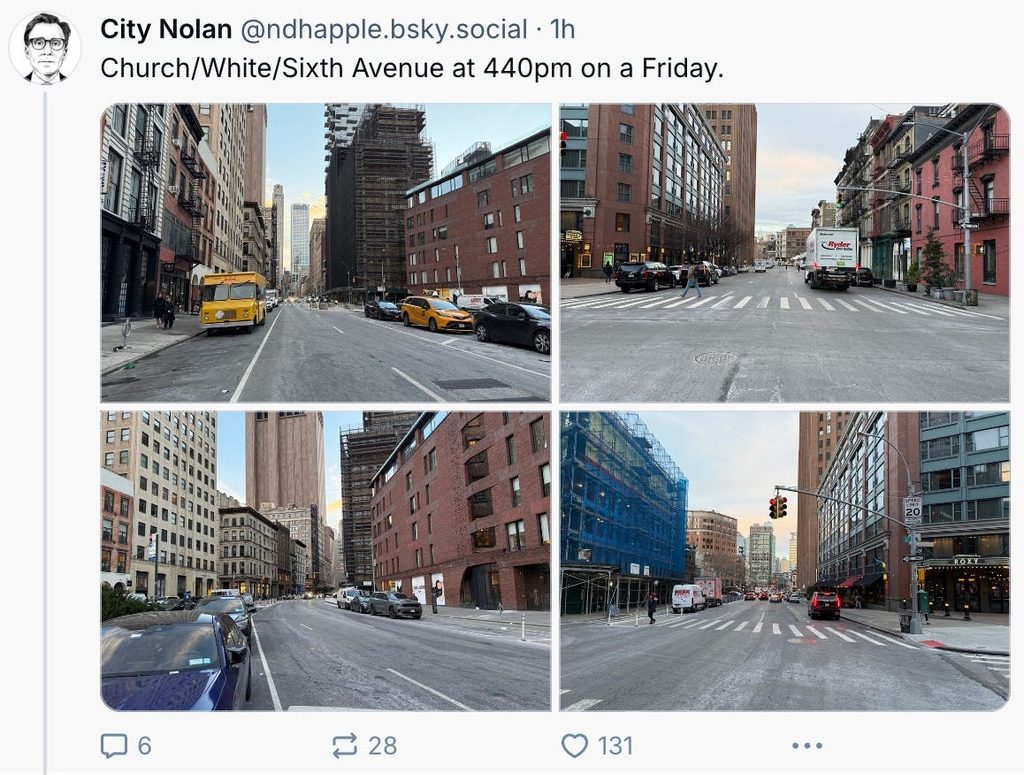
Second, monitoring should collect data on stock measures having to do with “how many cars are on the road at once.” They are things you could see in a photograph, such as the density of vehicles (i.e., the number of vehicles per block or per km) and the presence of “spillbacks” (i.e., “blocking the box”). Stock statistics are what the “man on the street” (whether on the sidewalk or in a car) thinks of as “heavy traffic.” Noise, local pollution, difficulty maneuvering, and difficulty crossing the street are downstream of high density. The screenshot below is someone noting the lack of cars on the road—a stock measure. The way to collect stock measures is to put cameras up high above the road—on buildings, poles or tethered drones—whose only job is to count and classify vehicles in the frame simultaneously (rather than to measure flows, speeds, or some other metric). Extant traffic cameras at intersections are not ideal. As Zuo et al. (2025) explain:
One particular challenge is the prevalent use of pan-tilt-zoom (PTZ) cameras in existing ITS deployments. These cameras often do not maintain a fixed field of view, as they are routinely repositioned to serve diverse operational needs (e.g., emergency response). This variability causes inconsistent visual data, even for the same location, introducing substantial bias and errors in automated traffic metrics and making longitudinal trend analysis unreliable.
This is why Zuo et al. (2025) develop a special methodology (including the use of LLMs) to estimate density from NYC’s existing traffic camera footage.
No doubt the lack of a monitoring plan reflects the CBDTP’s chaotic path to implementation, and the fact of its being the first such system in the Americas. But it may also, more broadly, reflect a lack of institutional confidence that the system would yield measured improvements worth advertising. The next city to adopt downtown congestion pricing should not have any doubts.